Kubernetes ft. Spring Boot (Series) - Monitoring with Istio #3

I know, I know.. YAML configuration is so fun, but have you ever heard of Kiali?
Brief
After we deployed the applications to the Kubernetes cluster and saw the power of its concepts in action (deployment, service, etc.) and how we can manage our services inside the cluster. We'll add another framework into the picture. Enter Istio.
Implementation
Istio - definition
Istio is a service mesh that gets applied over the Kubernetes cluster and enables us to get observability, monitoring, and traffic management over our applications.
Istio - installation
I'll keep it really short, with the emphasis on 'really' and even more on 'short'. Straight from the official website installation guide:
$ curl -L https://istio.io/downloadIstio | sh -// get the latest istio release binarycd istio-1.12.1// go to downloaded folder ( in this example1.12.1is the version downloaded)export PATH=$PWD/bin:$PATH// add the istioctl client to the pathistioctl install -y// install istio componentskubectl label namespace default istio-injection=enabled// this label is needed so the envoy proxy gets added to every pod in thedefaultnamespace
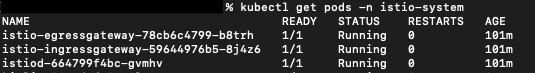
After getting through with the installation you should see a few pods installed to the istio-system namespace inside the cluster:
Finally, we need to scale down our deployments to zero and then rescale it again to any number of instances you like. The reasoning for this is that Istio, although installed in our cluster, it won't apply to already running pods.
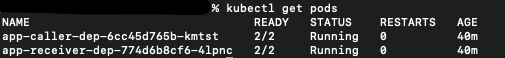
That being said, after rescaling the deployment, each pod will have now two containers: the application and the envoy proxy added by Istio. To check this, you can run:
kubectl get pods// to get the pods' names. This will return a list like:
2. kubectl get pods app-caller-dep-6cc45d765b-kmtst -o jsonpath="{.spec.containers[*].name}" // to get the containers' names from a specific pod. The result will be: app-caller istio-proxy
Istio - 'addons'
In order to have a visual control plane we need to add two plugins to Istio: Kiali and Prometheus.
- Kiali
-
get the Kiali yaml file with all its components https://raw.githubusercontent.com/istio/istio/release-1.12/samples/addons/kiali.yaml
-
for our Minikube cluster we need to change this file a little. Search for the Service definition and we'll need to change its type to a NodePort so we can access it from outside of our cluster
-
the file should look something like this:
apiVersion: v1 kind: Service metadata: labels: app: kiali app.kubernetes.io/instance: kiali app.kubernetes.io/managed-by: Helm app.kubernetes.io/name: kiali app.kubernetes.io/part-of: kiali app.kubernetes.io/version: v1.42.0 helm.sh/chart: kiali-server-1.42.0 version: v1.42.0 name: kiali namespace: istio-system spec: ports: - name: http port: 20001 protocol: TCP targetPort: 20001 nodePort: 30001 - name: http-metrics protocol: TCP port: 9090 selector: app.kubernetes.io/instance: kiali app.kubernetes.io/name: kiali sessionAffinity: None type: NodePort -
install using the updated file:
kubectl apply -f updated-kiali.yaml
-
- Prometheus
- install using the Prometheus yaml file:
kubectl apply -f https://raw.githubusercontent.com/istio/istio/release-1.12/samples/addons/prometheus.yaml
- install using the Prometheus yaml file:
Kiali console
Accessing the visual console of Kiali is as easy as:
- running
minikube ipto get the ip of the local cluster ( e.g.192.168.64.7) - open a browser and go to
192.168.64.7:30001(30001- Kiali's exposed port)
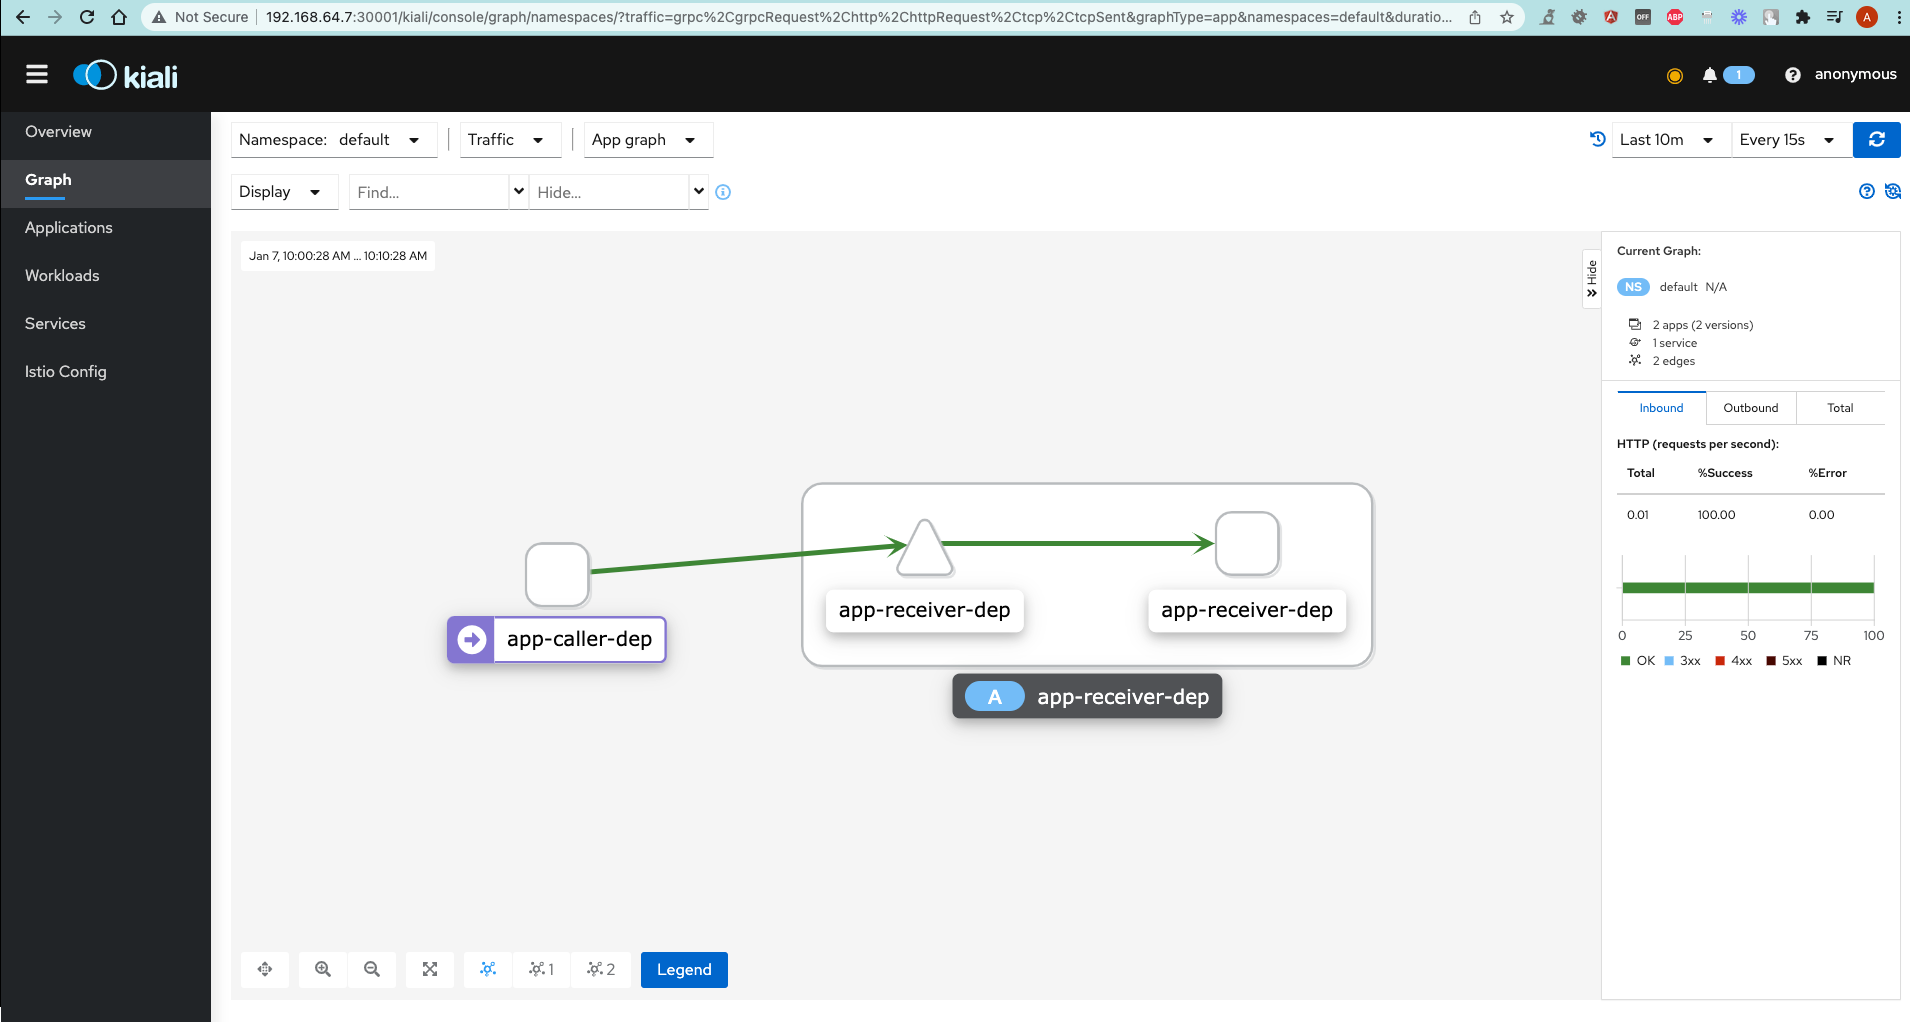
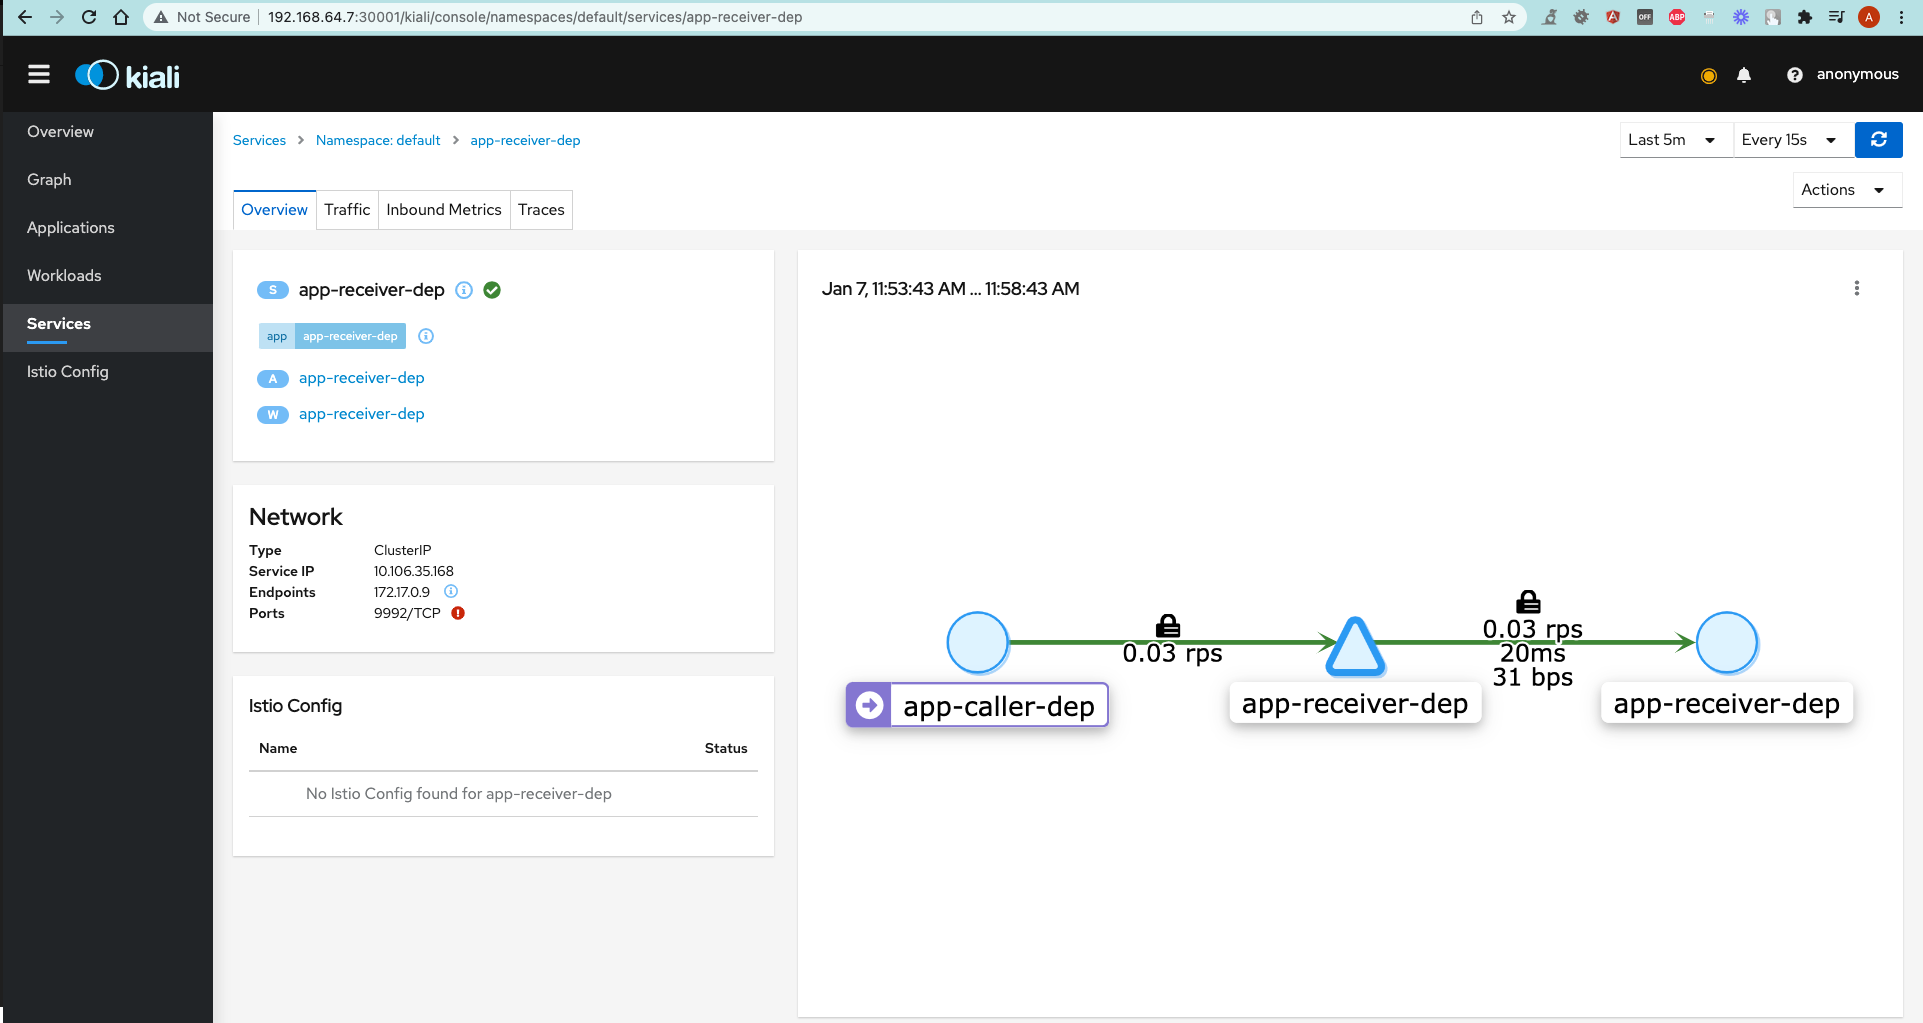
As you can see, Kiali provides a nice picture of the applications in our cluster, and the way they communicate with each other.
Bonus
Other than just showing the apps, communication between them and other traffic data, Kiali has some more really useful features.
Let's look at how we can play around with traffic rules between applications directly from Kiali's control plane.
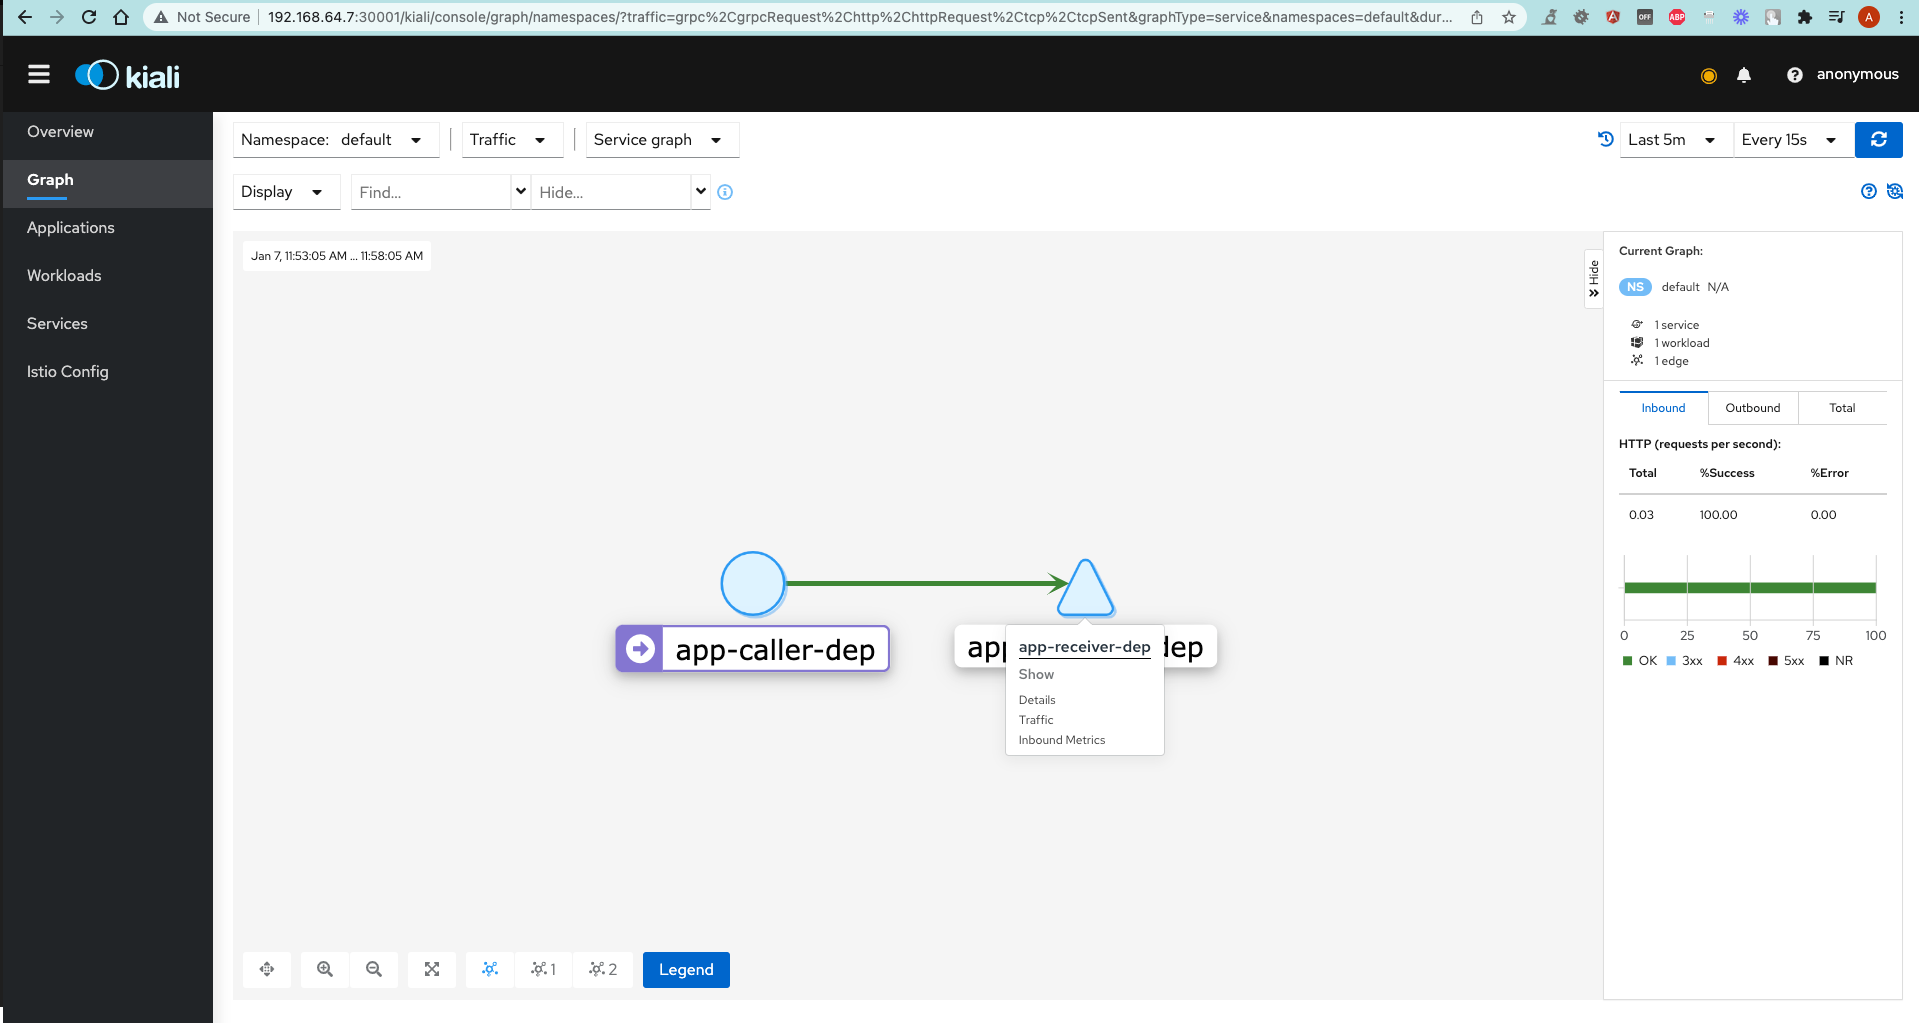
- Go to Graph tab.
- Right-click on the
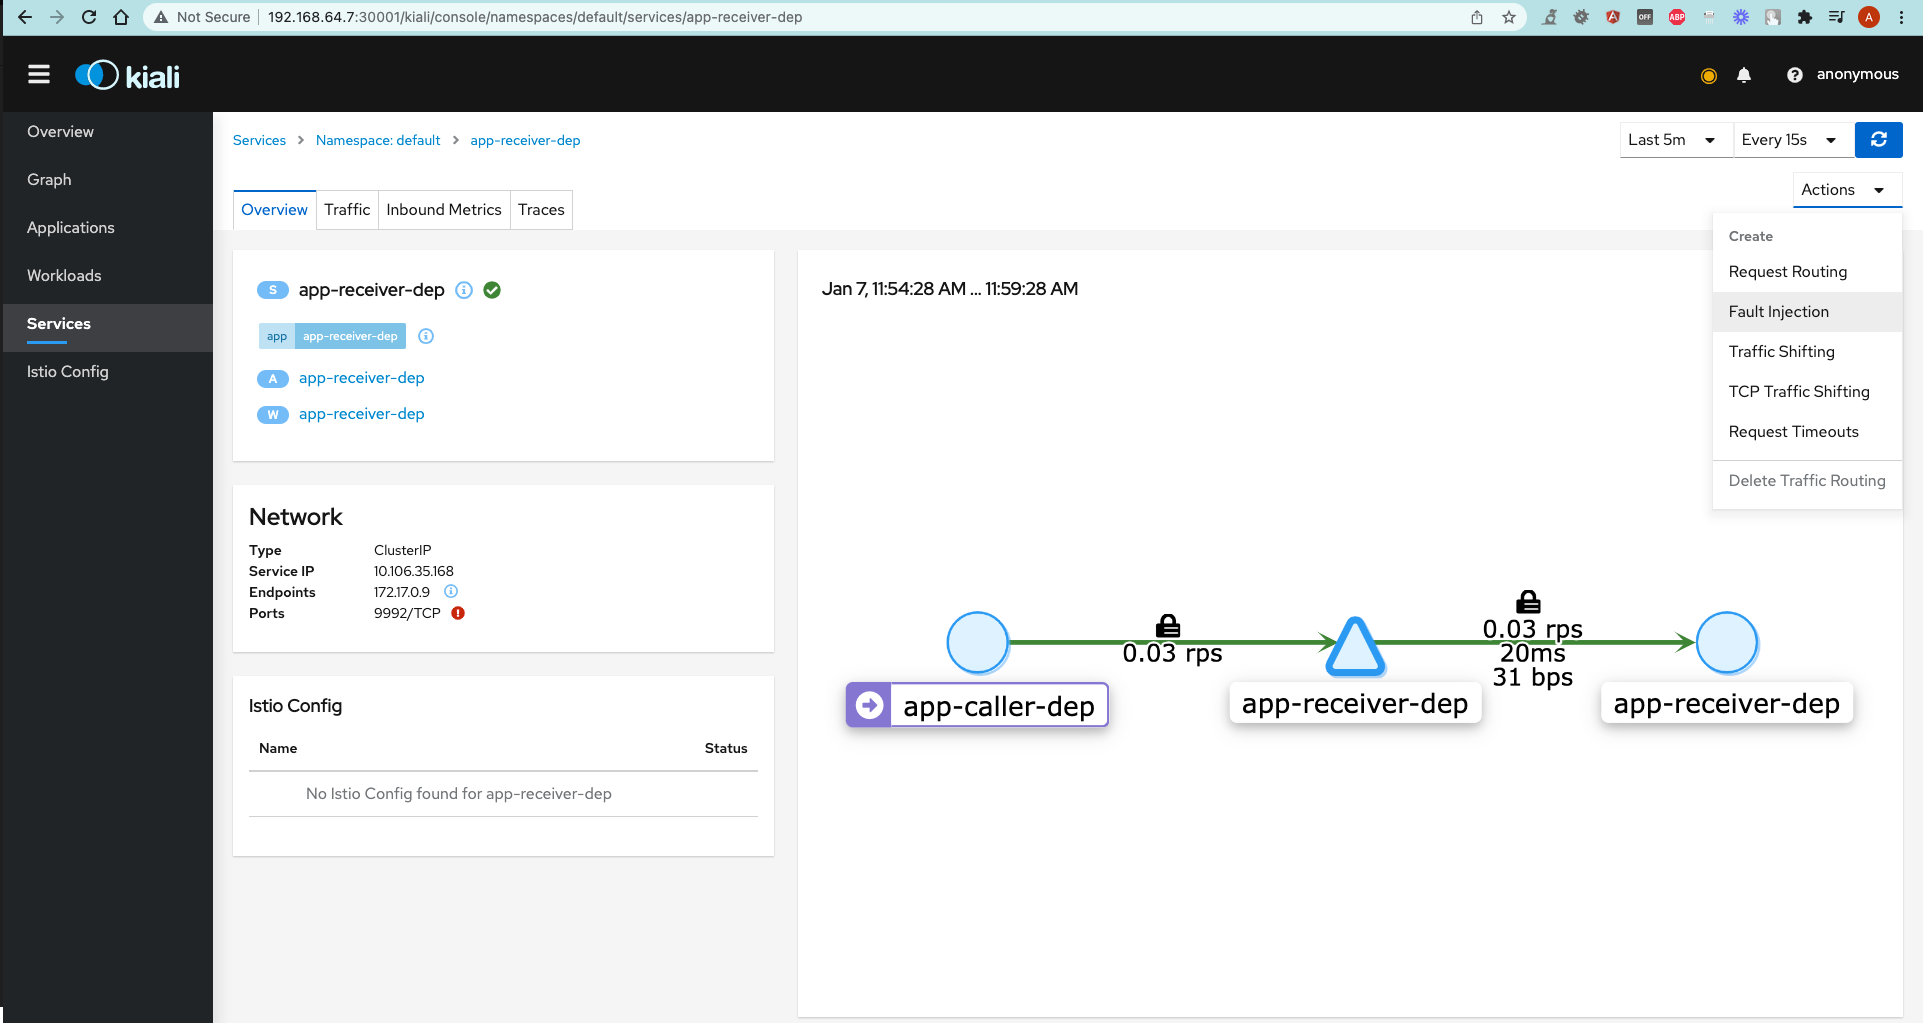
app-receiver-depservice and chooseShow details. - Click on
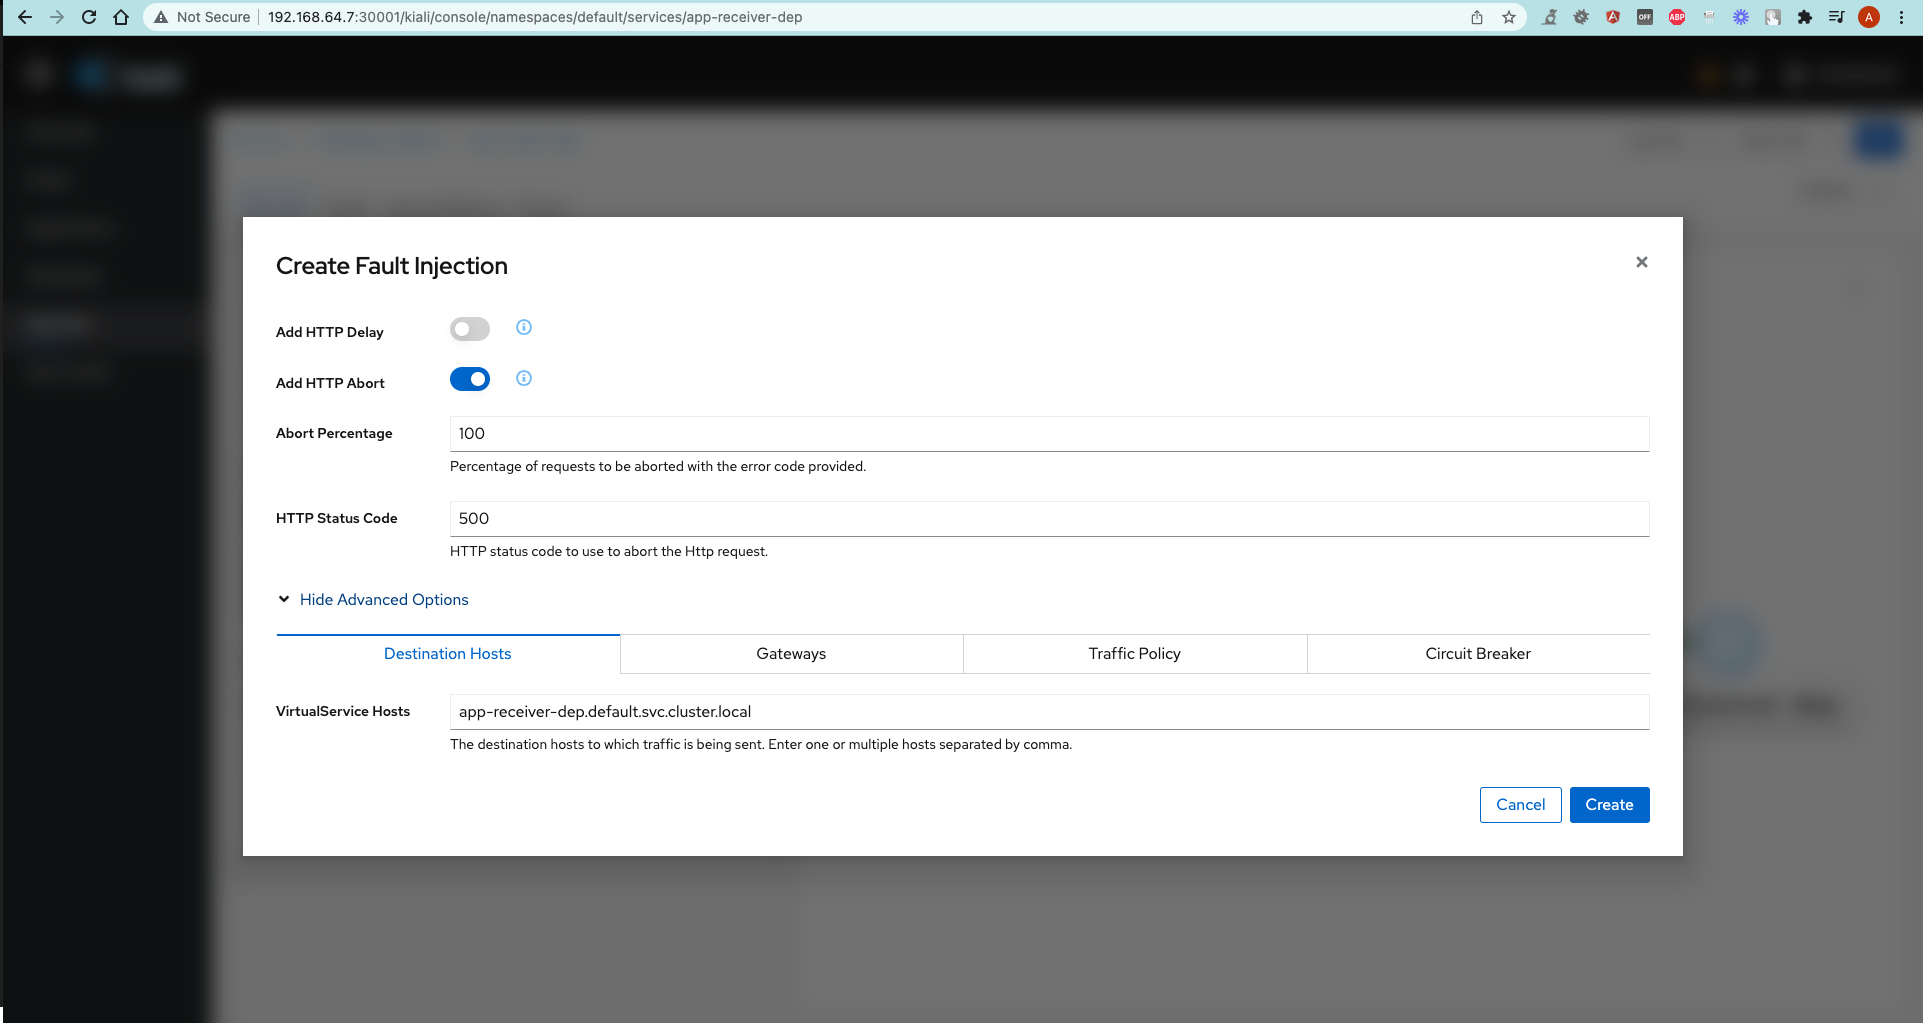
Actionsdropdown and selectFault injection. - Check
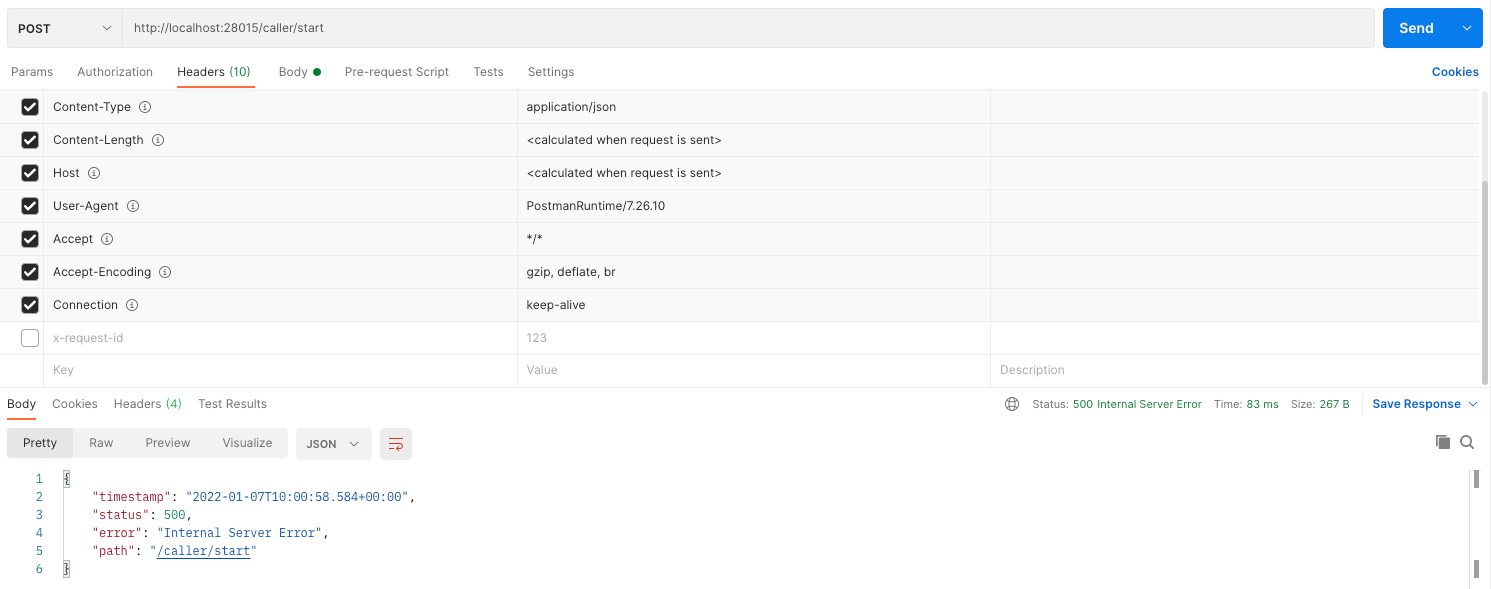
Add HTTP Abortand choose any HTTP error code this service should respond with. - Check with a Postman Request.
Stay tuned! 🚀